mycopula
Joint Probability Density Function and Its Visualization
After knowing how to fit a copula, now we learn how to estimate the joint distribution (joint CDF) and joint density function (joint PDF) values.
Load Data
With the same example data as before, here is how.
load stockreturns
x = stocks(:,1:2);
C = bivariatefit(x,'verbosity',0); % to not display result information
Return the Joint CDF and Joint PDF
It is very simple to return the value with
jcdf = jointcdf(C,x);
jpdf = jointpdf(C,x);
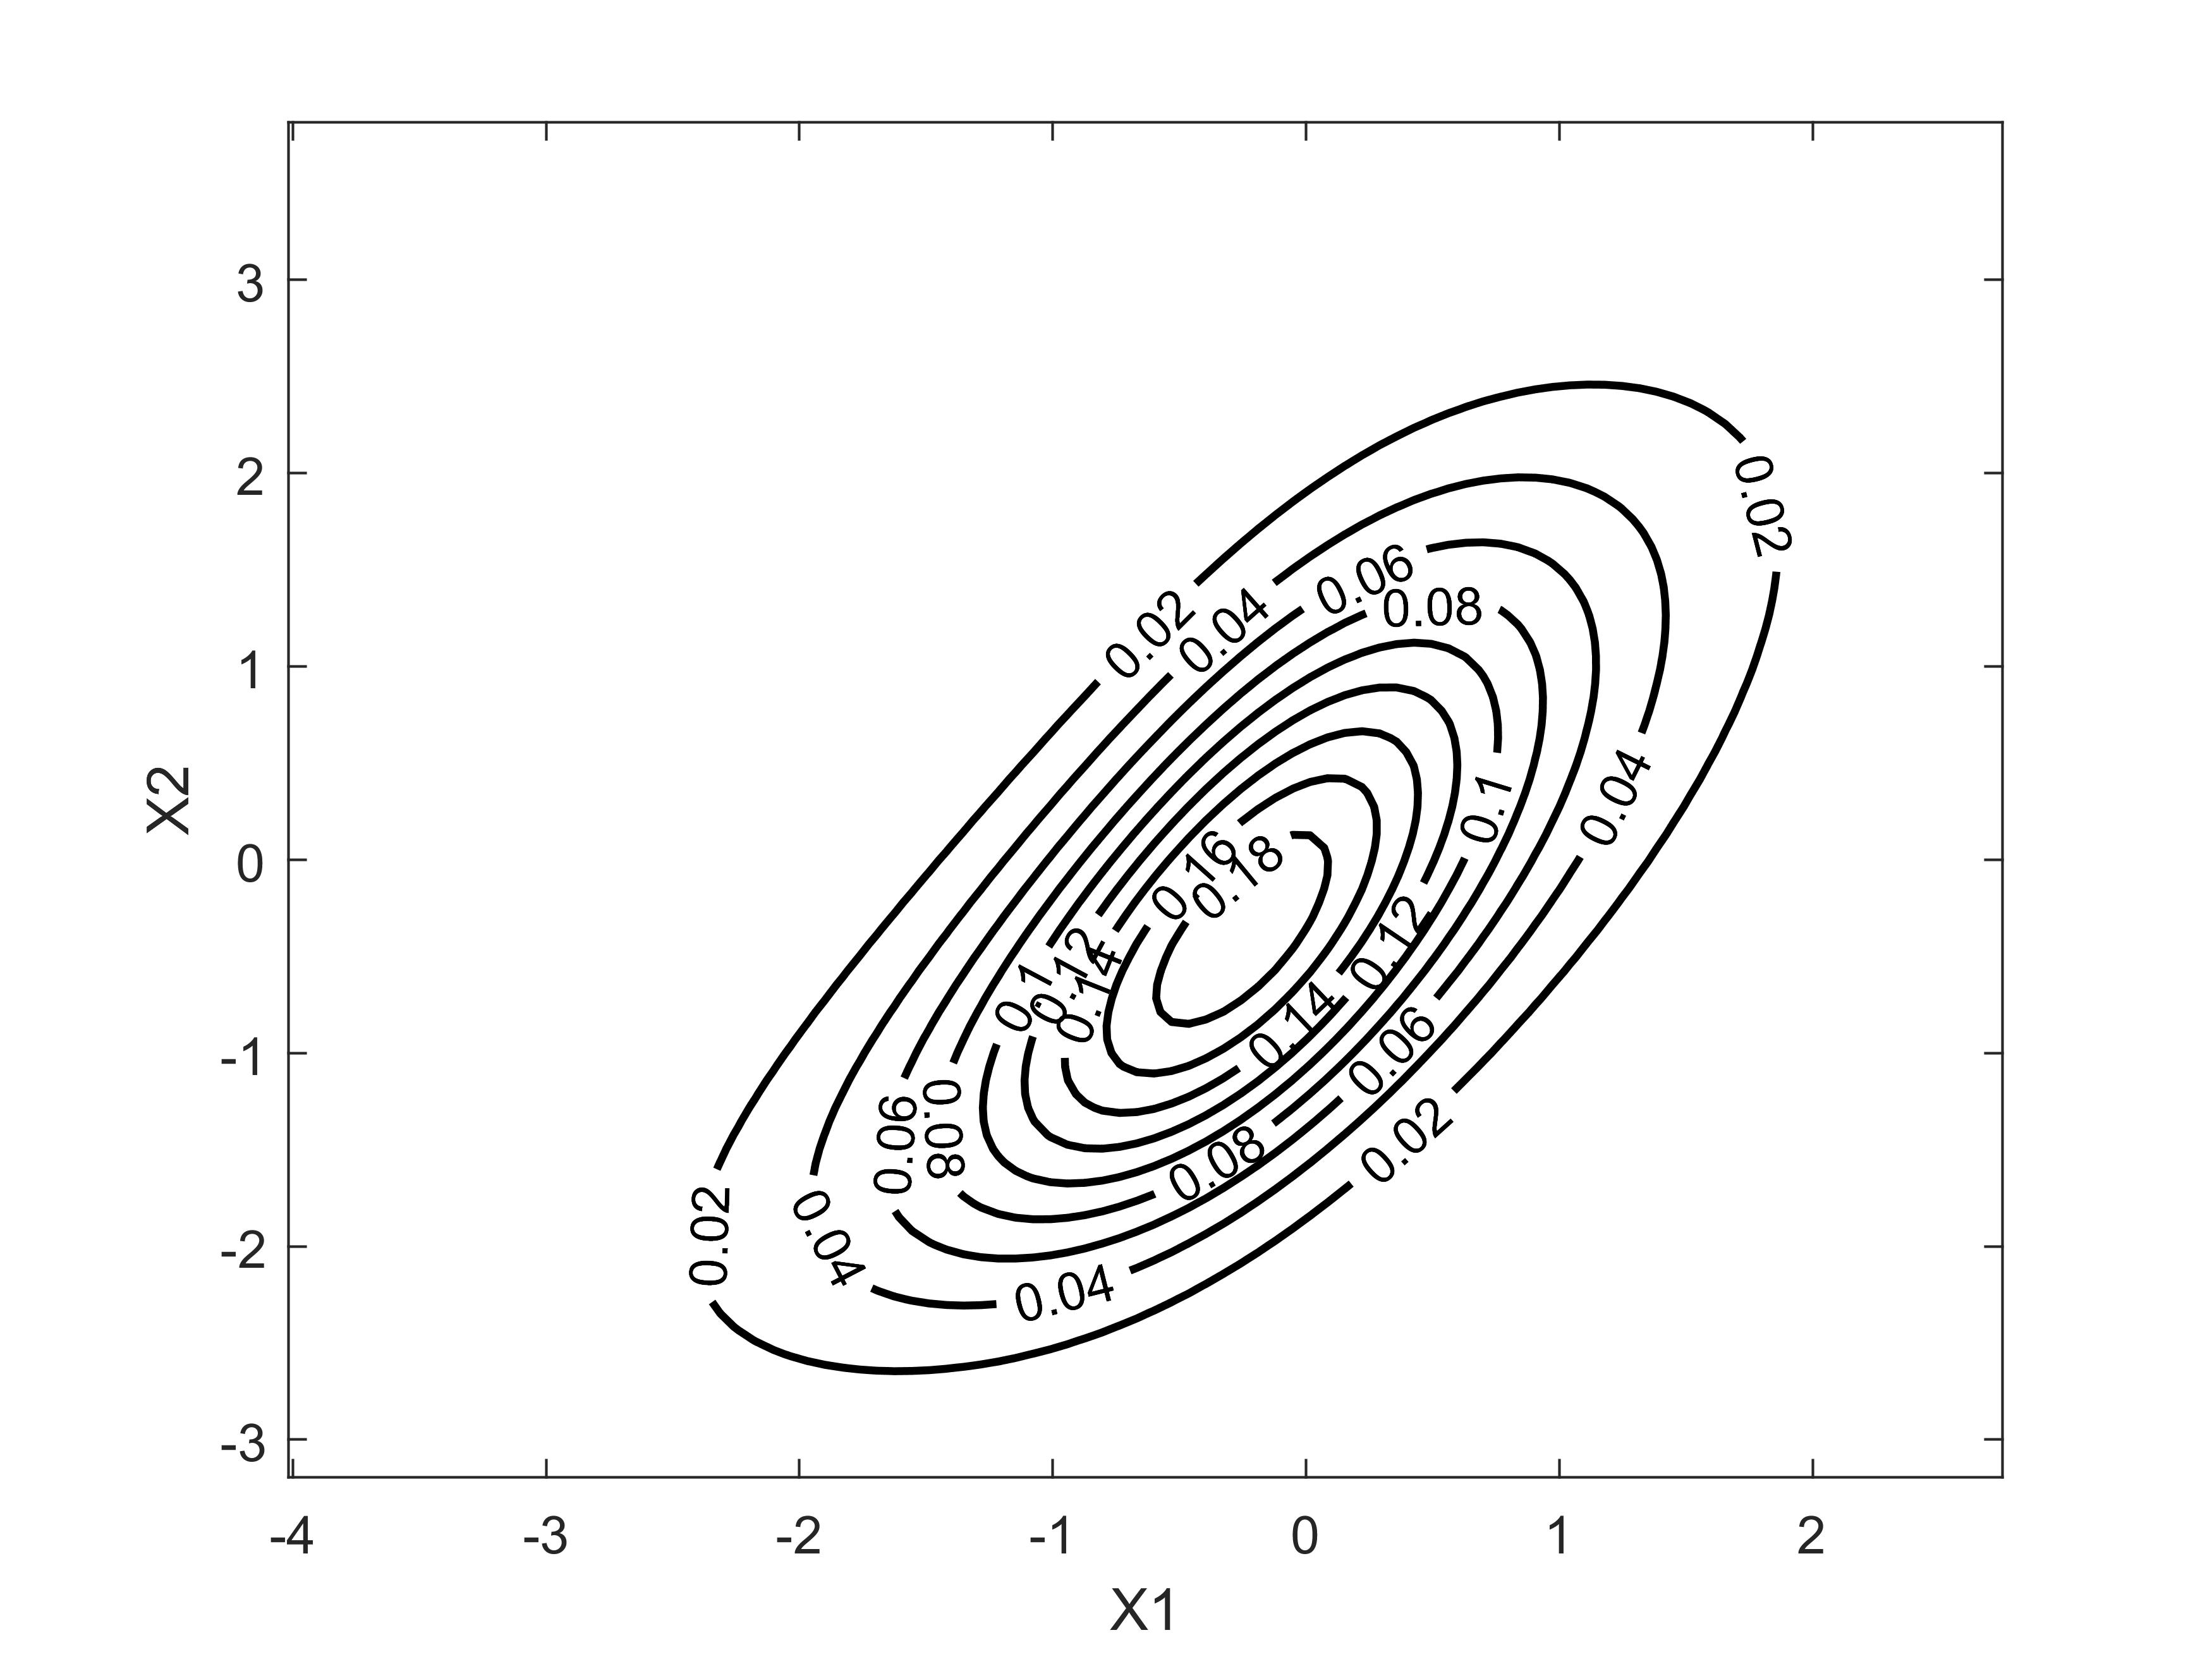
Visualize the Joint PDF
Only the contour plot
load stockreturns
x = stocks(:,1:2);
biplot(x);
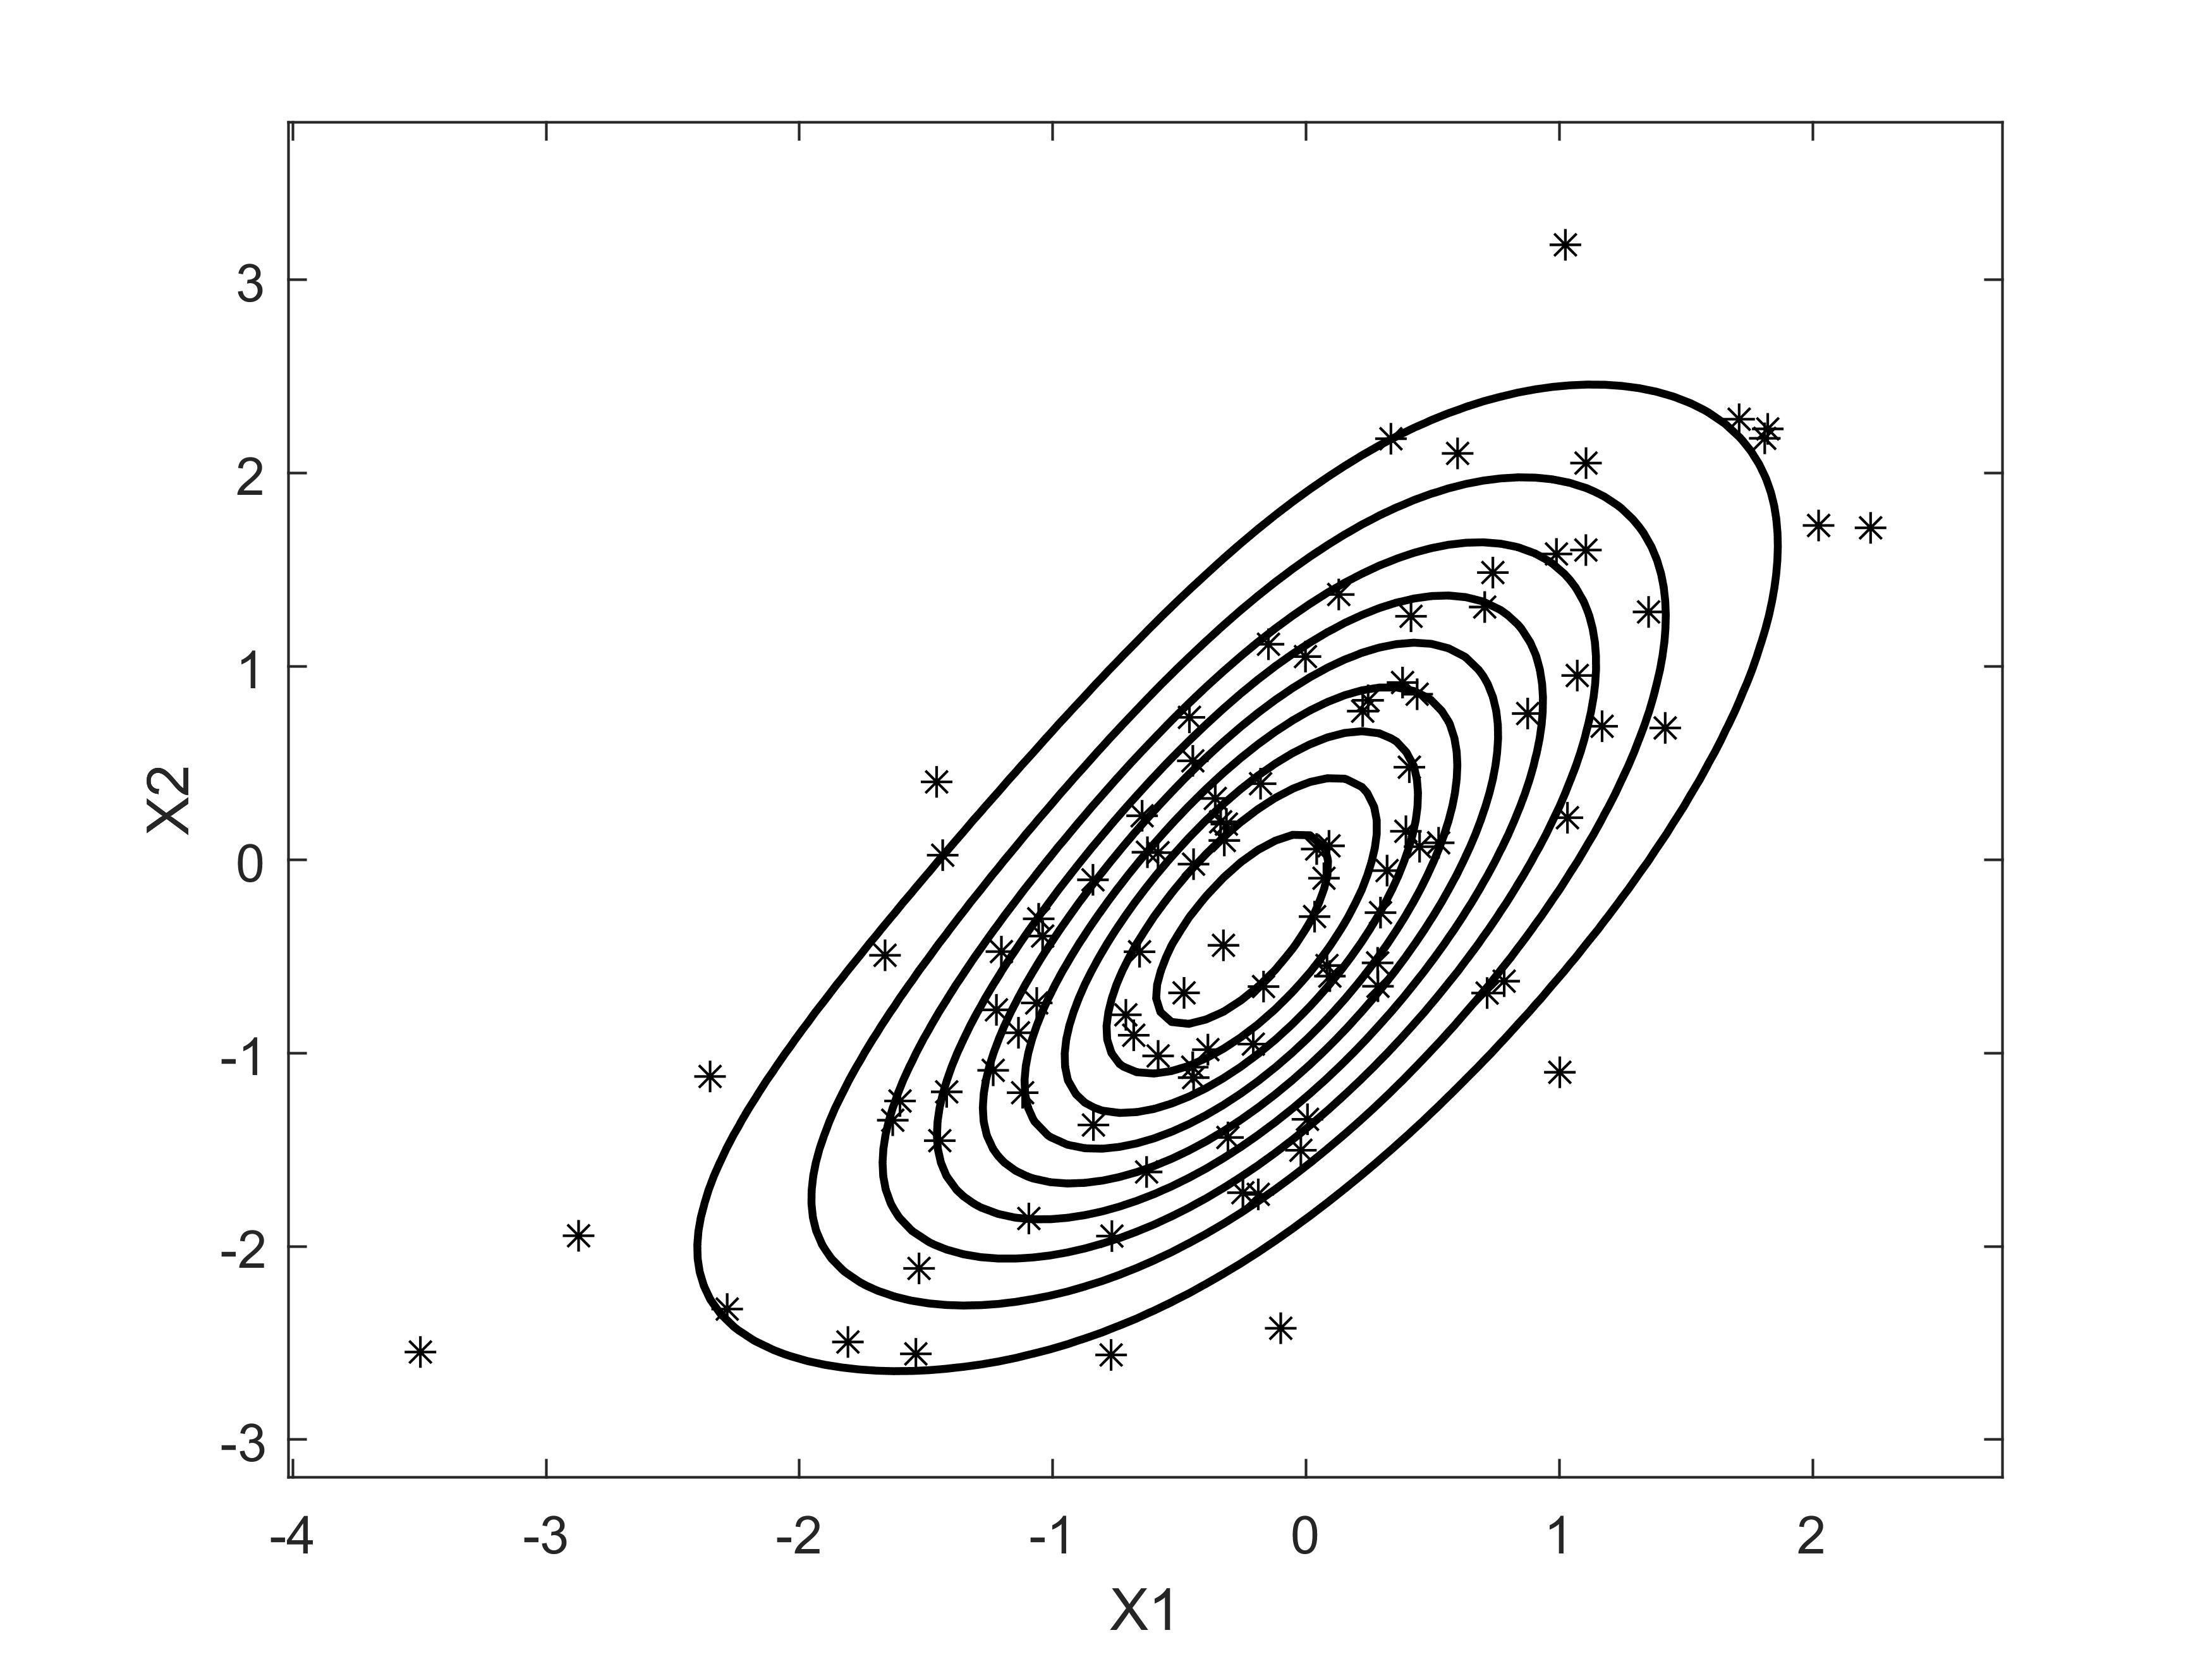
Contour plot with data
biplot(x,'showdata',1,'showtext','off');
Download: this example is available on demo2.m. Visit Github
Visit my personal blog
@ 2021-2023 Mohamad Khoirun Najib